Overview
Charts is a website which helps users create interactive charts without writing
a single line of code. To use it, you simply upload a spreadsheet (a .csv or
.tsv file) and await the results. The website, also, stores you charts so you
can access them from anywhere on the internet (firewalls permitting). Each chart
is stored as a .html file which means you can easily share them with
others. It's as simple as attaching them to email.
Technical Overview, with a Slight Detour
I built this website with Common Lisp and Caveman2 and the charting features in
Python and Bokeh. The reason for the mix-n-match approach is because I didn't
intend to write a website. And, if I'm being honest, I didn't intend to write a
Python program, either. A friend asked me to look at some data and help
access/open it on the computer. The actual aim was to create a chart and that
was easy enough to do in something like Microsoft Excel or Libre Office Calc;
So, task complete. Great Success! Moving on...
...and this project is a consequence of me moving on. I had a bit of free time
at the end of a day -- a Tuesday if I recall correctly. So, I wrote a Python
script (with Bokeh) to make a chart with said data. I noticed I could write a
CLI program so I didn't need to change the Python script every time I wanted to
change something or produce a new chart. From there, I realised I could build a
website which could call said CLI program which meant my friend, or whomever,
could create their own charts without me. This was not 'all part of the plan'. I
got carried away and here we is where I/we/us/you landed.
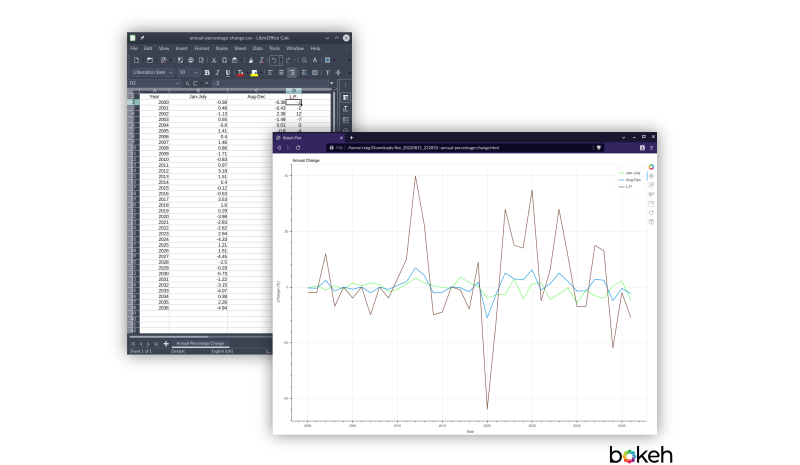
One of the reason for wanting to create a chart with Bokeh was its fancy
interactive features. The charts in Microsoft Excel and Libre Office Calc tend
to be static or cumbersome to deal with -- at least in my experience. Charts
created with Bokeh, though, have the default ability of zooming in and out of
the chart and moving around within it. I have used it before, as well. For more
information of the technologies used, please use the links at the end of this
page.
I wrote the website in Common Lisp because I felt like it. There is no technical
argument for or against it. I just felt like it. I used Caveman2 because that's
what I know best -- of all the Common Lisp web frameworks/libraries.
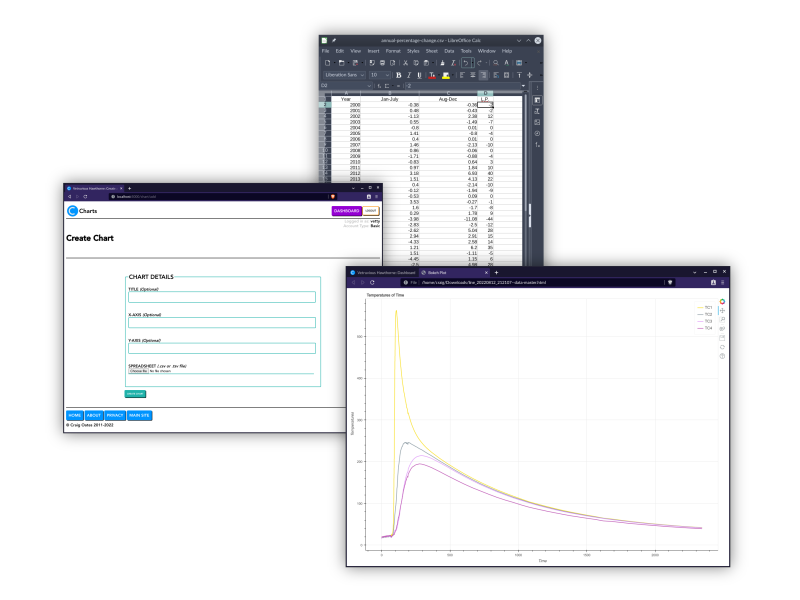 Upload a spreadsheet, fill out a form and Charts will do the rest.
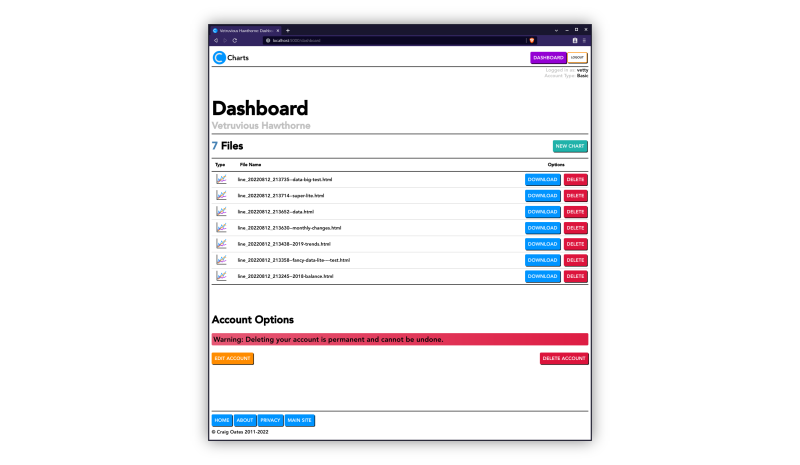 Charts stores your charts as .html files so you can access (or delete) them
anywhere on the internet and shared them as simply as attaching them to an
email.
Charts stores your charts as .html files so you can access (or delete) them
anywhere on the internet and shared them as simply as attaching them to an
email.
Project Limitations
At the time of writing (August 2022), the website can only produce line
charts. This is because the initial aim was to create a line chart. With
that said, the website can technically call different Python programs (if I
write them) which can produce different types of charts. I might expand the
types of charts the website can produce but I don't want to promise anything. I
might get bored or distracted by some new shiny thing. I did build this on a
whim after all.
The website proudly declares,
Turn your spreadsheets into interactive charts, without writing a single line
of code.
Because of this, it can only use a subset of Bokeh's functionality and it needs
to assume certain things about how you organised your data. If you need the more
elaborate features of Bokeh, this website is not for you. You will most likely
need to write some Python yourself. The Bokeh project, also, has some
documentation on using Bokeh with Jupyter (if Jupyter is and it's more your
thing).
The (Charts) website only accepts Comma-Separated Value and Tab-Separated Value
files (.csv and .tsv). You will need to export your Microsoft Excel (.xls) and
Open Document Formats (.ods, .odt Etc.) files before you can upload them to the
server. I don't know how likely this is to change.
This one is not really a limitation but it should help clarify an assumption you
might have. The website stores your charts for you (as .html files) but it
doesn't store the spreadsheets you upload. As soon as the website has created your chart,
it will delete the spreadsheet. In case you're wondering, you can delete the
.html on the server if you want.
Charts made with Bokeh have built-in interactive features. You can zoom in and
out with your mouse/track-pad, focus on a particular section and move around the
chart with ease.
Why the Website is Called 'Charts' but its Git Repository says 'hot-line'
When I created the Git repository, I called it 'hot-line' because I thought I
was being clever -- and I didn't intend to make it public. The data I was
originally handed included the change in temperate of a metal whilst it was
being welded and the desired chart was a line chart. Welds tend to occur in
straight lines, also. So, the 'line' from the weld was 'hot' and the 'line'
chart noted how 'hot' the temperate got. Yes, I agree, I should have been named
Witty McWitteringham.
I called it 'Charts' here because I didn't want to by a new domain name, at
least not at the time of writing (August 2022). On top of that, 'hot-line'
doesn't really help describe what the website is about. So charts.craigoates.net
it is but I'm not entirely comfortable with keeping the charts.craigoates.net
URL or 'Charts' name. Because of that, I tend to view 'hot-line' as a 'project'
name now.
Links